

Charts
Chart types
There are six different types of charts available for the question types Sinlge choice (Radiobuttons) and Multiple choice (Checkboxes):
For the question type Free answer text only the last two ones (List and Table) are available.
Bar
A bar chart is the default type. This is good for questions with not too much answers.

Bar
Horizontal Bar
A horizontal bar is useful when there are too many possible answers and the bar chart gets confusing.

Vertical Bar
Pie
A Pie chart is useful when you want to visualize proportions.

Pie
Doughnut
A doughnut chart is also useful to visualize proportions.

Doughnut
List
A list is a simple list of the answers with the number of votes in brackets:

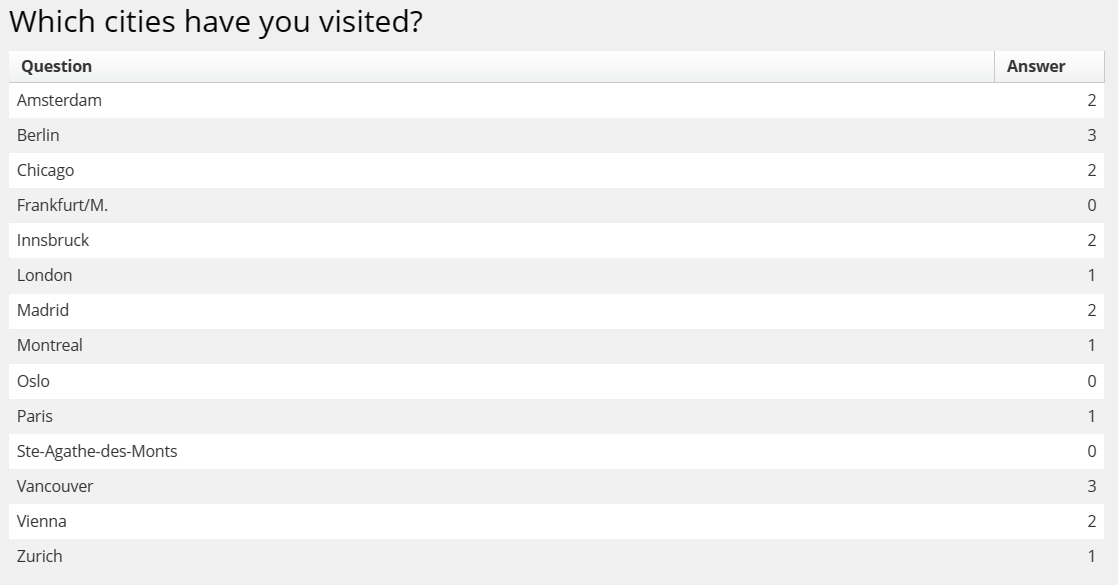
Table
A table displays the answers and the number of votes as a grid:
Updated about 3 years ago